Custom Dashboards
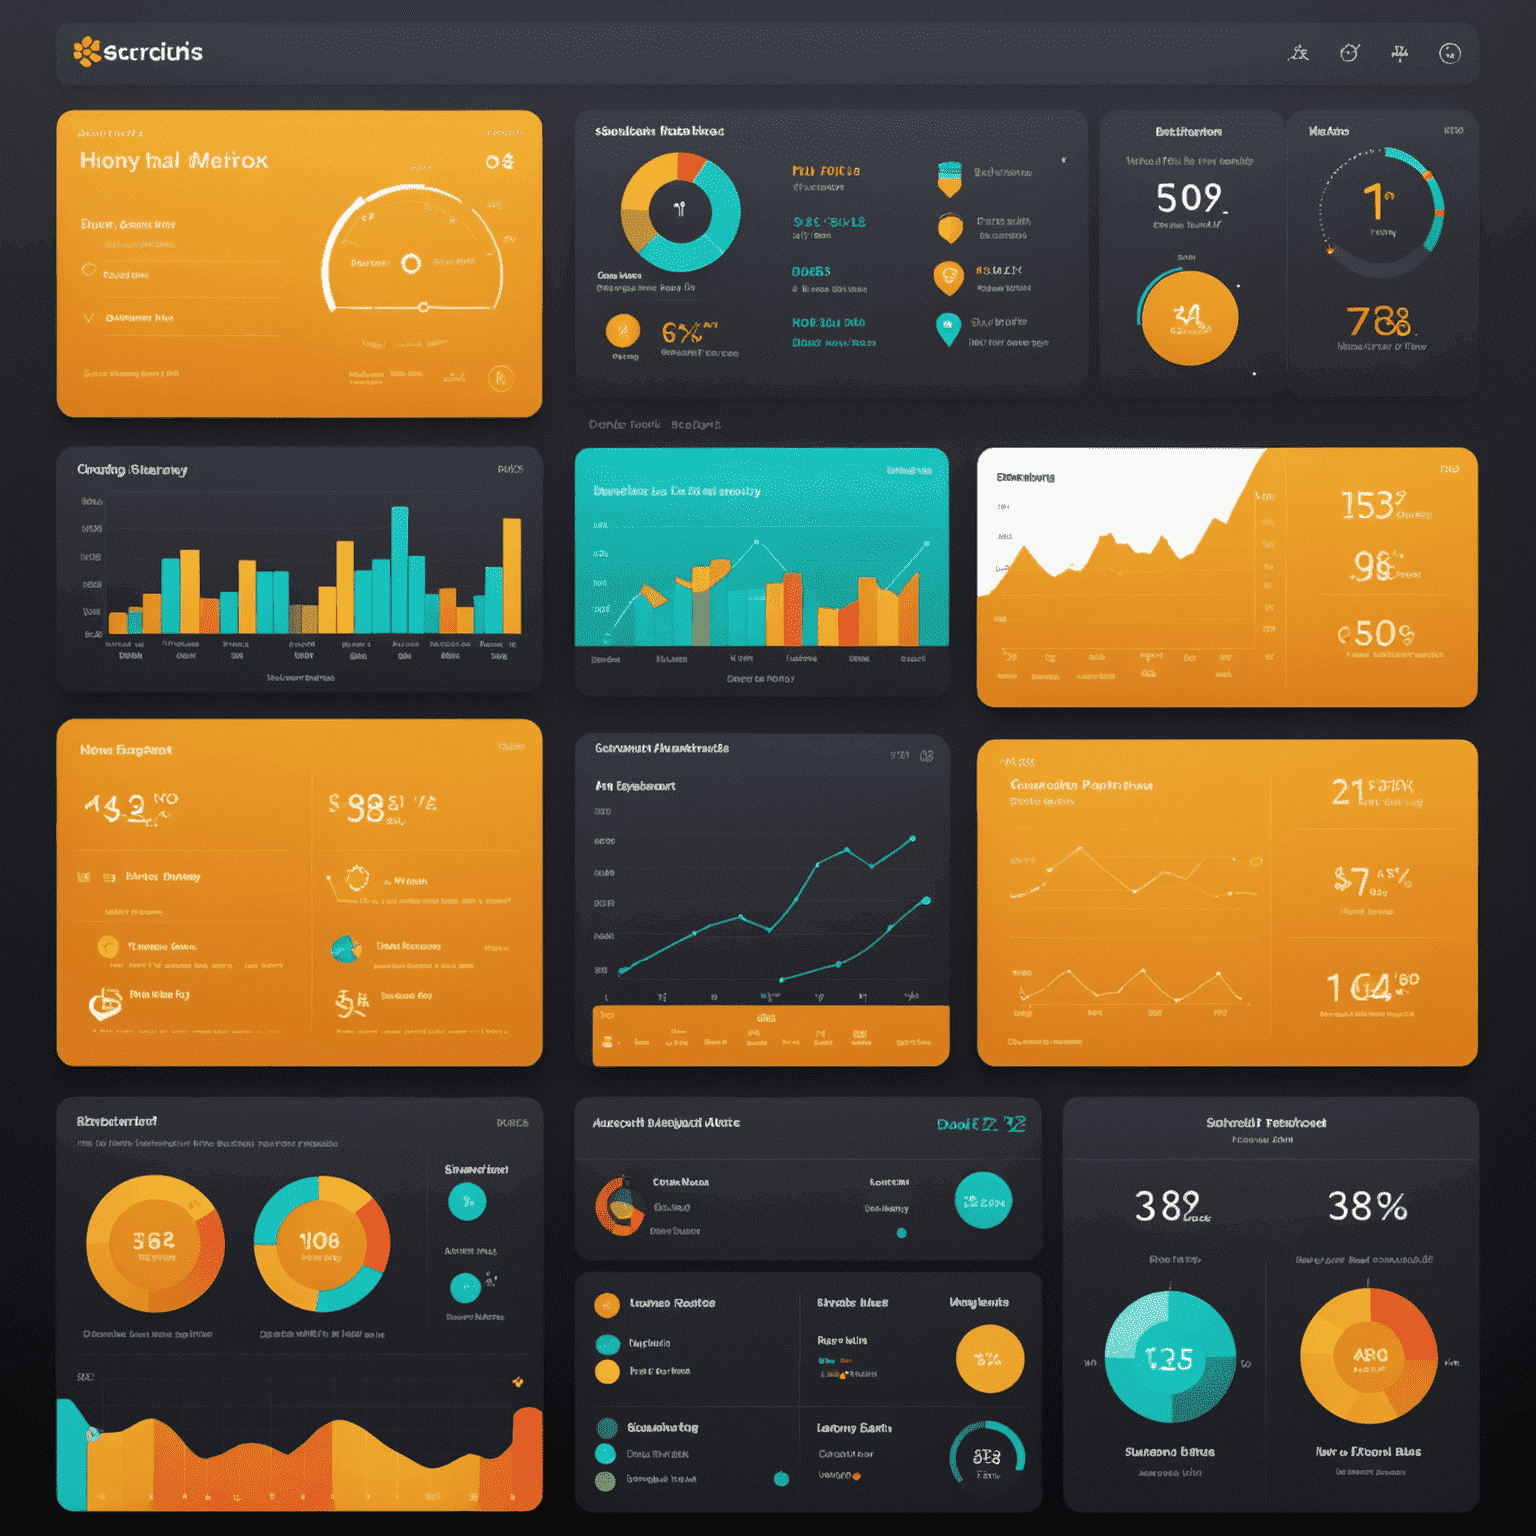
Create personalized, interactive dashboards to visualize key metrics and insights for your business.
Visualize Your Apiary's Performance
With ApiaryAnalytics' custom dashboards, you can transform raw data into actionable insights. Our powerful BI platform allows you to create stunning visualizations that bring your beekeeping data to life.
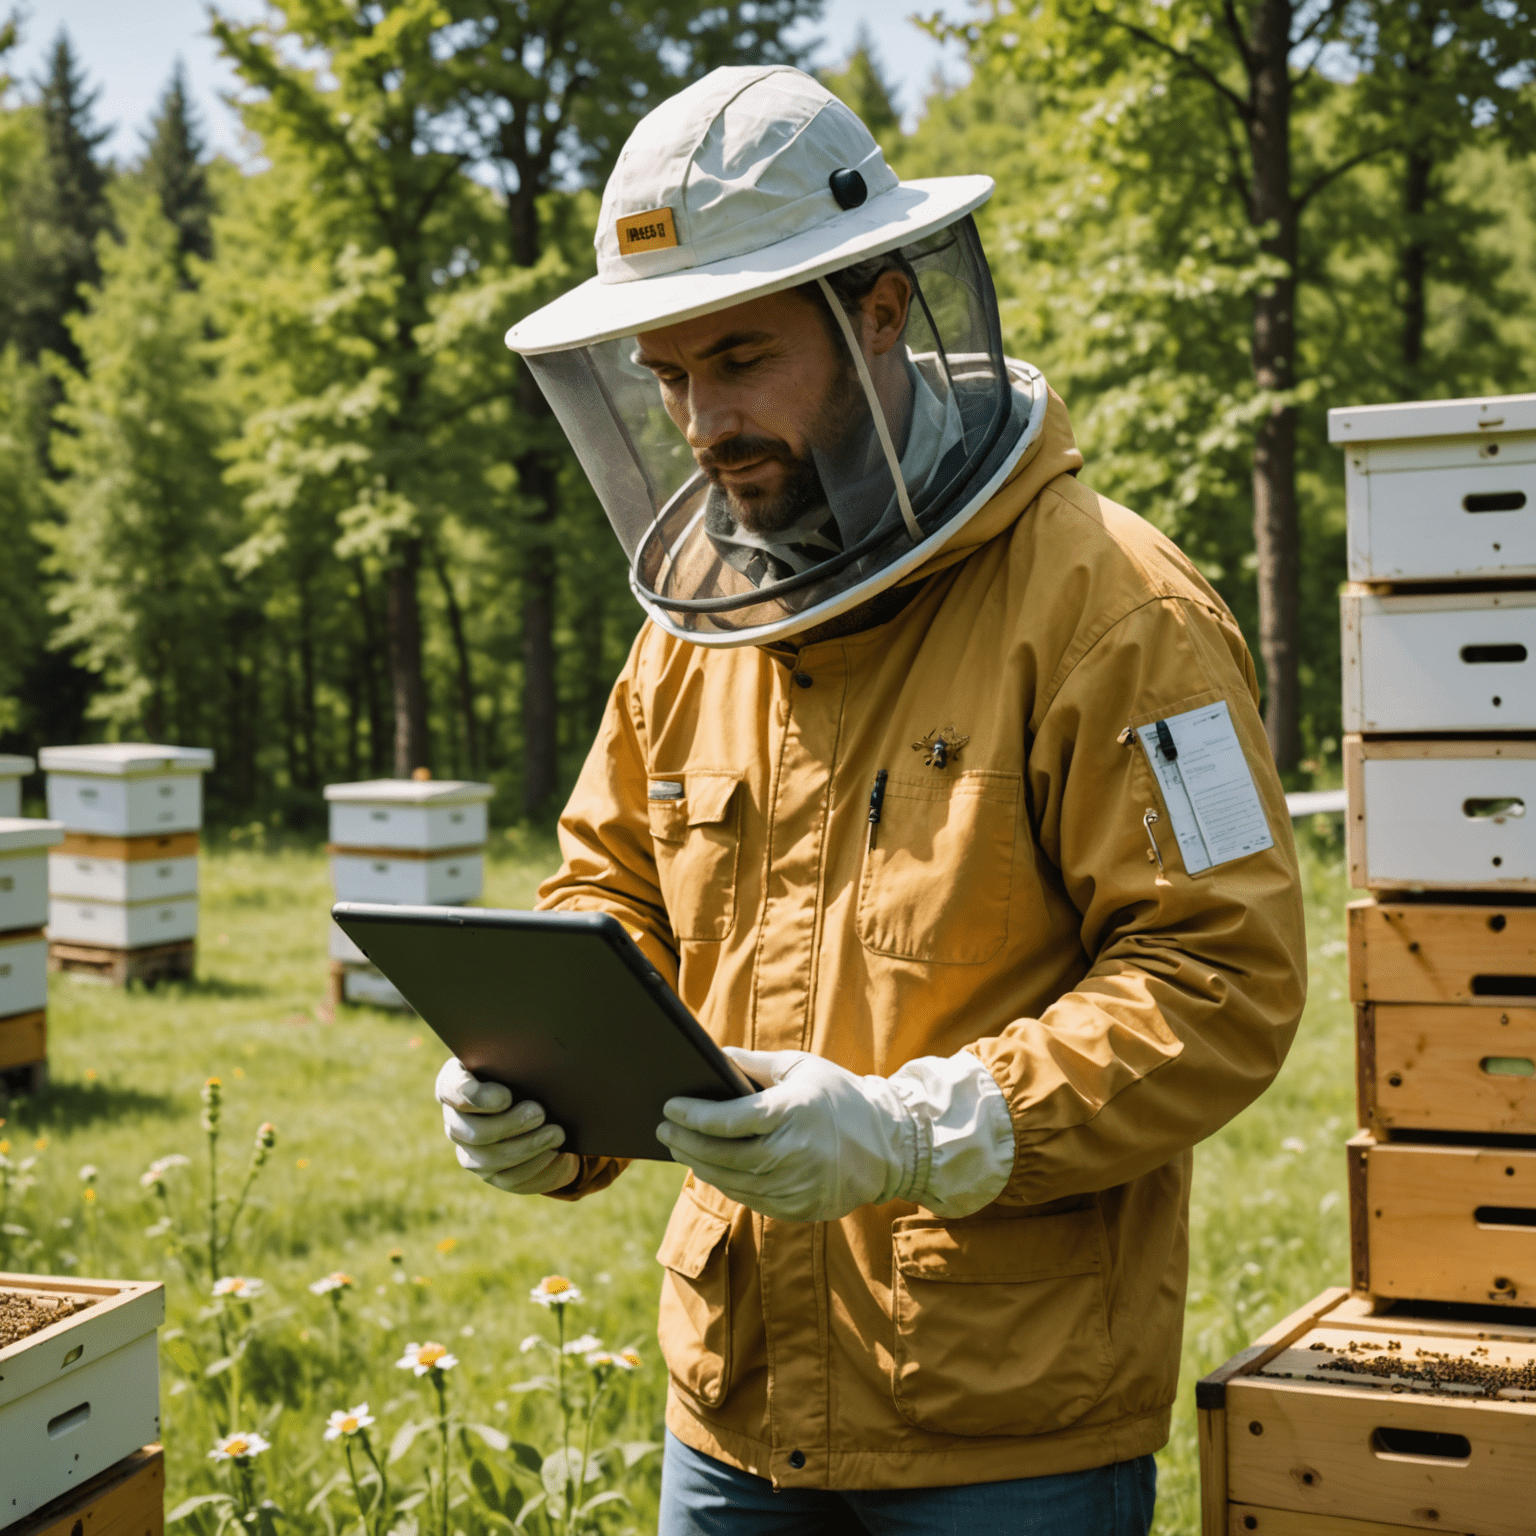
Real-time Monitoring
Keep track of your hives' health, productivity, and environmental conditions with real-time updates and alerts.
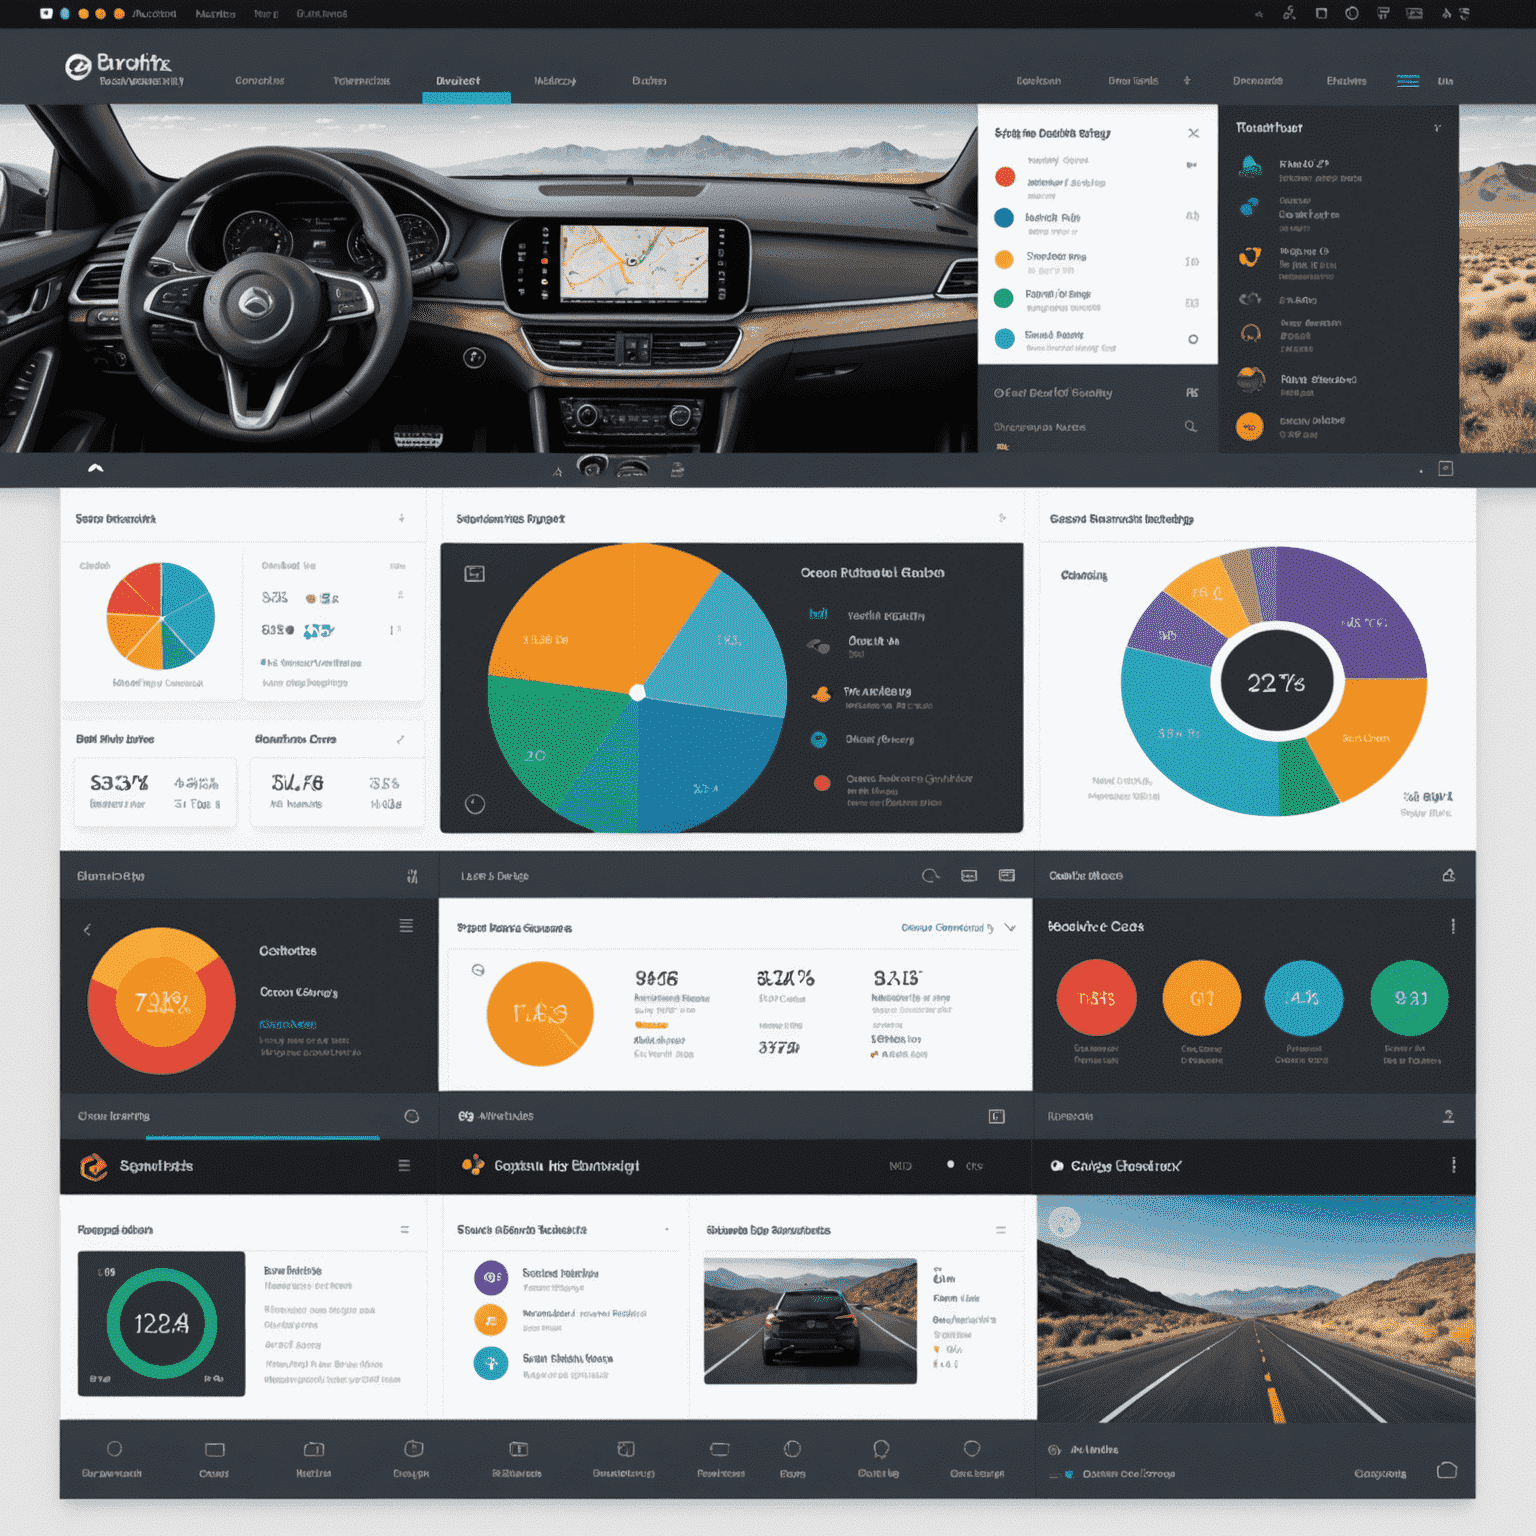
Customizable Widgets
Choose from a wide range of widgets to display the metrics that matter most to your apiary business.
Key Features of Our Custom Dashboards
- Interactive data visualizations
- Real-time data updates
- Customizable color schemes
- Mobile-responsive design
- Easy sharing and collaboration
Harness the Power of Agricultural IoT
Our custom dashboards seamlessly integrate with your agricultural IoT devices, providing a comprehensive view of your apiary's performance. From hive temperature to honey harvest forecasts, all your critical data is just a glance away.
Make data-driven decisions to optimize your beekeeping operations and boost productivity with ApiaryAnalytics' custom dashboards.